Balance Sheet
View assets, liabilities, and equity
Balance Sheet
The Balance Sheet report shows your company's financial position at a specific point in time. It summarises what your business owns (assets), what it owes (liabilities), and the residual interest of the owners (equity). Use this report to assess the financial health of your business, prepare for audits, or share a snapshot of your position with stakeholders.
How to Generate the Report
- Navigate to Reports from the sidebar.
- Under Financial Reports, click Balance Sheet.
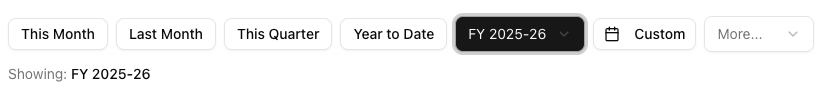
- Use the date picker at the top of the page to select the period you want to report on. You can choose from presets such as This Month, Last Month, This Quarter, or Year to Date, select a custom date range, or switch to a different financial year.
- The report generates automatically once a date range is selected — there is no separate "generate" button.
Understanding the Report
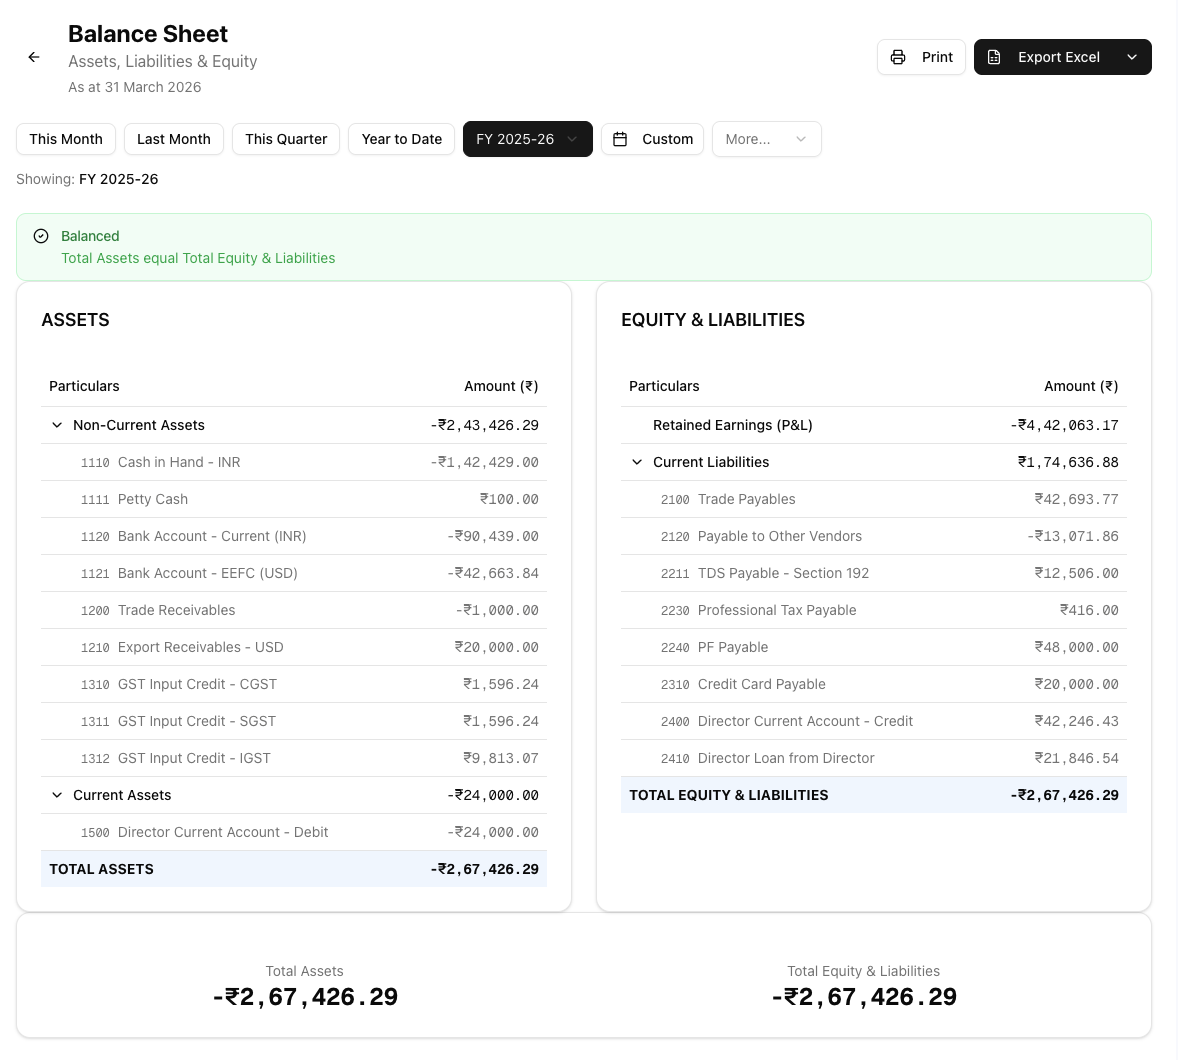
The Balance Sheet is displayed in a two-column layout:
Assets (Left Column)
Assets are grouped into two categories based on account code ranges:
- Non-Current Assets — Long-term assets such as property, equipment, and intangible assets (account codes 1000–1499). These are items your business owns that are not expected to be converted to cash within the current financial year.
- Current Assets — Short-term assets such as cash, bank balances, receivables, and inventory (account codes 1500–1999). These are items expected to be used or converted to cash within the year.
The total of both groups is shown as Total Assets.
Equity & Liabilities (Right Column)
This column is grouped into three categories:
- Shareholders' Funds — Share capital and other equity contributions (account codes 3000–3999).
- Retained Earnings — The cumulative profit or loss carried forward from prior periods. This figure is calculated automatically from your Profit & Loss data for the selected period.
- Current Liabilities — Short-term obligations such as payables, taxes due, and other amounts owed within the year (account codes 2000–2999).
The total of all three is shown as Total Equity & Liabilities.
Balanced Status
At the top of the report, an alert indicates whether the Balance Sheet is Balanced or Not Balanced. A balanced report means Total Assets equals Total Equity & Liabilities. If the report is not balanced, the difference is displayed — this typically points to unposted journal entries or miscategorised accounts that need attention.

Expanding and Collapsing Sections
Each account group (Non-Current Assets, Current Assets, Shareholders' Funds, Current Liabilities) can be expanded or collapsed by clicking its header. When expanded, you can see every account in that group along with its individual balance.
Exporting the Report
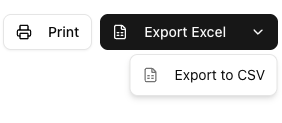
If you have the reports export permission, three export options are available from the report header:
- Excel (.xlsx) — Downloads a spreadsheet with Section, Particulars, and Amount columns (e.g.
Balance_Sheet_31-Mar-2025.xlsx). This is the primary export option. - CSV — Downloads a plain-text comma-separated file with the same column structure, useful for importing into other tools.
- Print — Opens your browser's print dialog so you can print the report or save it as a PDF using your browser's built-in "Save as PDF" option.
If you do not see the export buttons, ask your team admin to grant you the reports.export permission.
Tips and Best Practices
- Run the report at period end. Generate the Balance Sheet at the end of each month or quarter to track how your financial position changes over time.
- Check the balanced status first. If the report shows "Not Balanced", investigate before relying on the figures. Common causes include journal entries that have been created but not yet posted, or transactions recorded to incorrect account types.
- Cross-reference with the Trial Balance. The Trial Balance lists all account balances and confirms that total debits equal total credits. Run it alongside the Balance Sheet to verify consistency.
- Review Retained Earnings. Since retained earnings are derived from the Profit & Loss statement, ensure your revenue and expense entries are complete and posted before generating the Balance Sheet.
- Use the financial year selector. When comparing year-over-year position, switch between financial years using the date picker rather than manually entering dates.
Related Articles
- Trial Balance — Verify that all account balances are correct before generating financial statements.
- Profit & Loss Statement — Review income and expenses for the period, which feed into retained earnings on the Balance Sheet.
- Date Ranges — Learn more about the date picker presets and financial year options available across all reports.
- AR Aging Reports — Track overdue customer invoices by age bucket to prioritise collections.